We have gone through 3 posts already and have learned how to standardize ASH data for sizing, reviewed some basic statistics like mean, median, maximum and minimum and the use of percentiles to calculate the CPU requirement for a single instance database.
In this post we want to show a way to figure out what is the appropriate percentile that we can use to size our database workload.
We have been using a single instance Oracle Database for our examples and we are going to continue to use single instance database workload to keep things simple for now. The example we are going to use is a different database workload with a lot less active sessions to make it even simpler to understand.
Table: CPU_STANDARD_EX2 (stands for example 2)
Lets grab some statistics on this database workload.
SELECT MIN(sample_time) START_TIME, MAX(sample_time) END_TIME, ROUND(MAX(sample_time) - MIN(sample_time)) Retention
FROM cpu_standard_ex2;

START_TIM END_TIME    RETENTION
--------- --------- -----------
04-AUG-16 19-AUG-16          15
We had our retention period set to 15 days thus we have data collected for 15 days starting Aug 4th and ending Aug 19th.
SELECT MIN(cpu_data) MINIMUM, MAX(cpu_data) MAXIMUM
FROM   cpu_standard_ex2;

    MINIMUM     MAXIMUM
----------- -----------
          0           9
This database has a minimum CPU utilization of 0 and a maximum of 9 active sessions.
SELECT AVG(cpu_data) AVERAGE, MEDIAN(cpu_data) MEDIAN
FROM   cpu_standard_ex2;

    AVERAGE      MEDIAN
----------- -----------
.3778628907           0
The average is not even 1 active session and the median is 0. The median is the 50th percentile and we can state that the most popular value in this database workload is 0.
To have a visualization we can summarize the data into hourly data points with the maximum value per hour.
SELECT   TO_CHAR(TRUNC(sample_time,'HH24'), 'YYYY-MM-DD"T"HH24') THE_HOUR, MAX(cpu_data) CPU_DATA
FROM     cpu_standard_ex2
GROUP BY TRUNC(sample_time,'HH24')
ORDER BY 1;

THE_HOUR         CPU_DATA
------------- -----------
2016-08-04T06           1
2016-08-04T07           1
2016-08-04T08           1
2016-08-04T09           1
...
...
2016-08-18T21           2
2016-08-18T22           3
2016-08-18T23           2
2016-08-19T00           2
2016-08-19T01           2
2016-08-19T02           1
2016-08-19T03           1
2016-08-19T04           1

359 rows selected.
We create a table with the hourly cpu data to create a line chart in excel as explained in Sizing post #2: The not so good mean, the bad median, and the ugly minimum and maximum.
CREATE TABLE cpu_standard_ex2_hourly AS
SELECT   TO_CHAR(TRUNC(sample_time,'HH24'), 'YYYY-MM-DD"T"HH24') THE_HOUR, MAX(cpu_data) CPU_DATA
FROM     cpu_standard_ex2
GROUP BY TRUNC(sample_time,'HH24')
ORDER BY 1;
Here is the chart for hourly data points for our example 2 database workload:
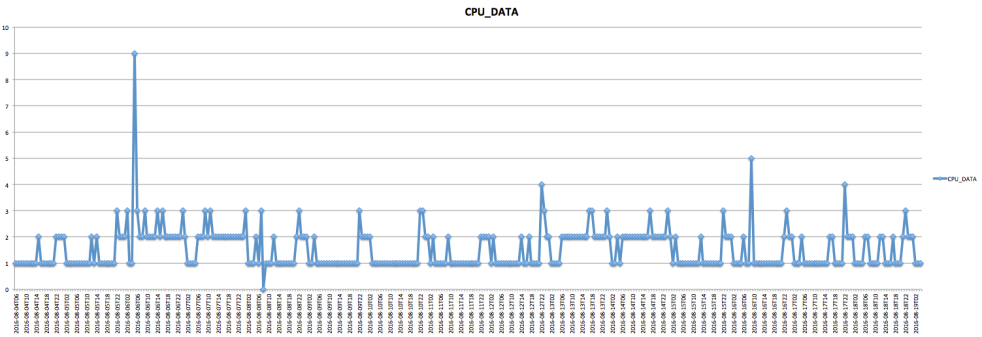
Because we are summarizing with the maximum, most of the data points will not be 0 but at least 1, however, remember that it does not mean that the whole hour was 1 active session. Lets take a look at some detail on a specific hour.
CREATE TABLE cpu_standard_ex2_aug_16 AS
SELECT   TO_CHAR(sample_time, 'YYYY-MM-DD"T"HH24:MI:SS') THE_HOUR, cpu_data
FROM     cpu_standard_ex2
WHERE    TO_CHAR(TRUNC(sample_time,'HH24'), 'YYYY-MM-DD"T"HH24') = '2016-08-16T05'
ORDER BY 1;

See how the majority of our data points are 0 with some at 1.
Lets get the hour where we had our maximum of 9.
SELECT * FROM
(
SELECT   TO_CHAR(TRUNC(sample_time,'HH24'), 'YYYY-MM-DD"T"HH24') THE_HOUR, MAX(cpu_data) CPU_DATA
FROM     cpu_standard_ex2
GROUP BY TRUNC(sample_time,'HH24')
ORDER BY 2 DESC
)
WHERE ROWNUM <=1;

THE_HOUR         CPU_DATA
------------- -----------
2016-08-06T05           9
Generating table and chart:
CREATE TABLE cpu_standard_ex2_aug_06 AS
SELECT   TO_CHAR(sample_time, 'YYYY-MM-DD"T"HH24:MI:SS') THE_HOUR, cpu_data
FROM     cpu_standard_ex2
WHERE    TO_CHAR(TRUNC(sample_time,'HH24'), 'YYYY-MM-DD"T"HH24') = '2016-08-06T05'
ORDER BY 1;
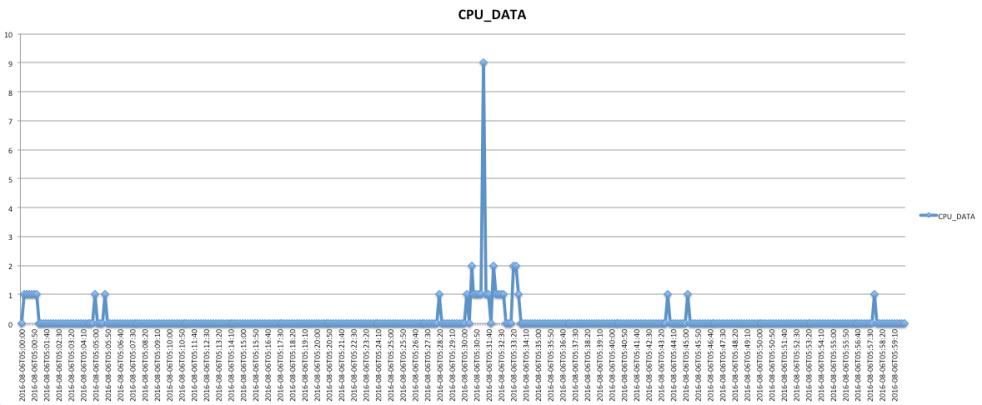
There is a spike in CPU utilization up to 9 active sessions on 2016-08-06 at 05:31:20. This is a one 10 second sample that had 9 active sessions, around that time the cpu utilization was 1 and 2.
It won’t be realistic to size with 9 because the workload is usually 0, 1 or 2 and it would be too much resource to size to the maximum of 9.
If we remember from our previous post
97th percentile -> longest wait is 1.8 min.
95th percentile -> longest wait is  3  min.
90th percentile -> longest wait is  6  min.
80th percentile -> longest wait is 12  min.
If we use our 95th percentile because we are willing to tolerate a maximum of 3 min wait, the calculation will be:
SELECT * FROM
(
SELECT TO_CHAR(TRUNC(sample_time,'HH24'),'YYYY-MM-DD"T"HH24') THE_HOUR
      ,ROUND(PERCENTILE_CONT(0.95) WITHIN GROUP (ORDER BY cpu_data)) "95th PERCENTILE"
FROM   cpu_standard_ex2
GROUP BY TO_CHAR(TRUNC(sample_time,'HH24'),'YYYY-MM-DD"T"HH24')
ORDER BY 2 DESC
)
WHERE ROWNUM <= 1;

THE_HOUR      95th PERCENTILE
------------- ---------------
2016-08-04T23               2
A 90th percentile would result in 1.
SELECT * FROM
(
SELECT TO_CHAR(TRUNC(sample_time,'HH24'),'YYYY-MM-DD"T"HH24') THE_HOUR
      ,ROUND(PERCENTILE_CONT(0.90) WITHIN GROUP (ORDER BY cpu_data)) "90th PERCENTILE"
FROM   cpu_standard_ex2
GROUP BY TO_CHAR(TRUNC(sample_time,'HH24'),'YYYY-MM-DD"T"HH24')
ORDER BY 2 DESC
)
WHERE ROWNUM <= 1;

THE_HOUR      90th PERCENTILE
------------- ---------------
2016-08-04T22               1
In fact using 97th percentile we also get 2 CPUs, same as with 95th percentile. If we get the results for various percentile values we can build a table like the following:
100th percentile ->          no wait         -> 9 CPUs
 99th percentile -> longest wait is  36 sec. -> 4 CPUs
 97th percentile -> longest wait is 1.8 min. -> 2 CPUs
 95th percenitle -> longest wait is  3  min. -> 2 CPUs
 90th percentile -> longest wait is  6  min. -> 1 CPU
 80th percentile -> longest wait is 12  min. -> 1 CPU
Here is where we come back to our question of what percentile to use.
It depends on how much pain (wait) we are willing to tolerate.
If we choose 4 CPUs for our system our potentially longest wait on our worst hour would be 36 seconds; if we are willing to tolerate a wait of 1.8 min in our worst hour we can choose the 2 CPUs. For this particular example we observe that going from 36 seconds to 1.8 min. will save 2 CPUs out of 4 CPUs, meaning I would have to double the amount of resources to cover for the extra coverage.
Lets say we pick the 2 CPUs and now we want to know how many times the CPU utilization went above those 2 CPUs. We can build a table to hold the number of samples above a specific number of CPUs. We need a procedure to populate such a table and a query to show the result:
CREATE TABLE samples_above
(cpu_required      NUMBER,
 end_date          DATE,
 samples_above     NUMBER
);

CREATE OR REPLACE PROCEDURE get_samples_above
(
 p_cpu_req          IN  samples_above.cpu_required%TYPE
) IS
BEGIN
   INSERT INTO samples_above
   SELECT p_cpu_req, TRUNC(sample_time, 'HH24'), COUNT(cpu_data) samples_above
   FROM cpu_standard_ex2
   WHERE cpu_data > p_cpu_req
   GROUP BY TRUNC(sample_time, 'HH24');
   DBMS_OUTPUT.PUT_LINE(' ');
   DBMS_OUTPUT.PUT_LINE('get_samples_above: CPU req ' || p_cpu_req);
   COMMIT;
END;
/

TRUNCATE TABLE samples_above;

SET SERVEROUTPUT ON
EXEC get_samples_above(2)

SELECT   cpu_required, TO_CHAR(end_date, 'YYYY-MM-DD"T"HH24') end_date_hour, samples_above
FROM     samples_above
ORDER BY cpu_required, samples_above DESC;

CPU_REQUIRED END_DATE_HOUR SAMPLES_ABOVE
------------ ------------- -------------
           2 2016-08-16T09             6
           2 2016-08-17T22             4
           2 2016-08-16T23             3
           2 2016-08-08T22             3
           2 2016-08-07T00             3
           2 2016-08-12T22             2
           2 2016-08-18T22             2
           2 2016-08-15T00             2
           2 2016-08-13T17             1
           2 2016-08-14T00             1
           2 2016-08-10T23             1
           2 2016-08-10T22             1
           2 2016-08-14T17             1
           2 2016-08-09T22             1
           2 2016-08-07T11             1
           2 2016-08-06T06             1
           2 2016-08-06T16             1
           2 2016-08-06T05             1
           2 2016-08-06T14             1
           2 2016-08-05T22             1
           2 2016-08-12T23             1
           2 2016-08-08T01             1
           2 2016-08-08T07             1
           2 2016-08-06T09             1
           2 2016-08-06T02             1
           2 2016-08-15T22             1
           2 2016-08-07T09             1
           2 2016-08-13T18             1

28 rows selected.
How do we interpret the output?
The busiest hour is 2016-08-16T09 with 6 samples above 2. we are referring to standardized ASH/AWR samples, the ones that are 10 seconds equidistant. There are 360 samples in one hour. If we have 6 samples above 2 CPUs and we assume that those samples are continuous, our longest wait on that hour would be 60 seconds.
If the samples above are not continuous then the waits would be less time. Lets find out if our samples above were continuous or spread within the hour.
CREATE TABLE how_long
(cpu_required    NUMBER,
 end_date        DATE,
 how_long_sec    NUMBER,
 how_long_min    NUMBER,
 max_sample      NUMBER
);

CREATE OR REPLACE PROCEDURE get_how_long
(
 p_cpu_req          IN  samples_above.cpu_required%TYPE
) IS
  CURSOR c_10s_t IS
    SELECT sample_time, cpu_data
    FROM cpu_standard_ex2
    ORDER BY sample_time;
  v_end_date            cpu_standard_ex2.sample_time%TYPE;  -- to fetch date
  v_store_end_date      cpu_standard_ex2.sample_time%TYPE;  -- to store the final list of dates where utilization went above #CPUs
  v_on_cpu              cpu_standard_ex2.cpu_data%TYPE;     -- to fetch on_cpu
  v_count               NUMBER := 0;  -- to count how many samples the CPU utilization stayed above #CPUs
  v_max_sample          NUMBER := 0;  -- to hold the max sample in each entry of org6_how_long_t
BEGIN
  OPEN c_10s_t;
  LOOP
    FETCH c_10s_t into v_end_date, v_on_cpu;
    EXIT WHEN c_10s_t%NOTFOUND;
    IF v_on_cpu > p_cpu_req THEN
      v_store_end_date := v_end_date;
      v_count      := 1;
      v_max_sample := v_on_cpu;
      LOOP
        FETCH c_10s_t into v_end_date, v_on_cpu;
        EXIT WHEN c_10s_t%NOTFOUND;
        IF v_on_cpu > p_cpu_req THEN
          v_count := v_count + 1;
          IF v_on_cpu > v_max_sample THEN
            v_max_sample := v_on_cpu;
          END IF;
        ELSE
          INSERT INTO how_long VALUES(p_cpu_req, v_store_end_date, v_count*10, (v_count*10)/60, v_max_sample);
          EXIT;
        END IF;
      END LOOP;
    END IF;
  END LOOP;
  CLOSE c_10s_t;
  DBMS_OUTPUT.PUT_LINE(' ');
  DBMS_OUTPUT.PUT_LINE('get_how_long: CPU req ' || p_cpu_req);
  DBMS_OUTPUT.PUT_LINE('get_how_long: Data in mn_how_long_t ');
  COMMIT;
END;
/

TRUNCATE TABLE how_long;
EXEC get_how_long(2);

SELECT cpu_required, to_char(end_date, 'YYYY-MM-DD"T"HH24:MI:SS') "TIME",
how_long_sec "SECONDS", round(how_long_min, 2) "MINUTES",
max_sample "MAX_SAMPLE"
FROM how_long
ORDER BY cpu_required, seconds DESC, max_sample DESC;

CPU_REQUIRED TIME                    SECONDS     MINUTES  MAX_SAMPLE
------------ ------------------- ----------- ----------- -----------
           2 2016-08-16T09:47:40          20         .33           5
           2 2016-08-17T22:00:30          20         .33           4
           2 2016-08-12T22:00:40          20         .33           4
           2 2016-08-06T05:31:20          10         .17           9
           2 2016-08-16T09:49:30          10         .17           5
           2 2016-08-16T09:50:30          10         .17           4
           2 2016-08-16T09:48:10          10         .17           4
           2 2016-08-16T09:51:20          10         .17           4
           2 2016-08-07T00:58:10          10         .17           3
           2 2016-08-07T09:16:50          10         .17           3
...
...
Each row in the table tells us the time the samples were above the number of CPUs and how long it took to go down again below the number of CPUs.
Our assumption was not true, the samples above 2 were not continuous, otherwise, we would have seen 60 seconds at the top but we see 20 seconds instead. At most we had 2 continuous samples.
We got the number of samples above 2 CPUs and how long it takes up above those 2 CPUs.
We can get the same information for 1 CPU:
TRUNCATE TABLE samples_above;

SET SERVEROUTPUT ON
EXEC get_samples_above(1)

SELECT   cpu_required, TO_CHAR(end_date, 'YYYY-MM-DD"T"HH24') end_date_hour, samples_above
FROM     samples_above
ORDER BY cpu_required, samples_above DESC;

CPU_REQUIRED END_DATE_HOUR SAMPLES_ABOVE
------------ ------------- -------------
           1 2016-08-09T22            35
           1 2016-08-17T23            26
           1 2016-08-12T22            25
           1 2016-08-06T06            24
           1 2016-08-05T23            23
           1 2016-08-08T22            23
           1 2016-08-08T01            22
           1 2016-08-05T01            22
...
...
           1 2016-08-12T03             1
           1 2016-08-18T06             1
           1 2016-08-14T04             1
           1 2016-08-06T02             1

154 rows selected.
The first row shows that there are 35 samples above 1 CPU. There are 360 samples in one hour, thus 35 samples represent 9.7%, very close to 10% which is 6 minutes.
Tying back to our percentiles table:
100th percentile ->          no wait         -> 9 CPUs
 99th percentile -> longest wait is  36 sec. -> 4 CPUs
 97th percentile -> longest wait is 1.8 min. -> 2 CPUs
 95th percenitle -> longest wait is  3  min. -> 2 CPUs
 90th percentile -> longest wait is  6  min. -> 1 CPU   <<<<<<  80th percentile -> longest wait is 12  min. -> 1 CPU
The 1 CPU is when we use 90th percentile, and potentially our longest wait could be 6 min.
Having the system not able to provide enough CPU resource for 6 minutes seems too long (we are not saying that a session would have to wait 6 min before it gets connected or have a response back, just that we are requesting more CPUs than CPUs available), therefore, we would not say that 1 CPU is enough to support this database workload. We can investigate if the samples above 1 are continuous.
TRUNCATE TABLE how_long;
EXEC get_how_long(1);

SELECT * FROM
(
SELECT cpu_required, to_char(end_date, 'YYYY-MM-DD"T"HH24:MI:SS') "TIME", how_long_sec "SECONDS", round(how_long_min, 2) "MINUTES", max_sample "MAX_SAMPLE"
FROM how_long
ORDER BY cpu_required, seconds DESC, max_sample DESC
)
WHERE ROWNUM <=10;

CPU_REQUIRED TIME                    SECONDS     MINUTES  MAX_SAMPLE
------------ ------------------- ----------- ----------- -----------
           1 2016-08-09T22:00:30         180           3           3
           1 2016-08-17T22:00:10         100        1.67           4
           1 2016-08-17T23:03:00          80        1.33           2
           1 2016-08-13T06:02:00          70        1.17           2
           1 2016-08-14T06:08:50          60           1           2
           1 2016-08-17T23:33:50          60           1           2
           1 2016-08-05T01:20:40          60           1           2
           1 2016-08-12T22:00:30          50         .83           4
           1 2016-08-06T16:00:50          50         .83           3
           1 2016-08-05T01:52:00          50         .83           2

10 rows selected.
The 35 samples above are not continuous, the maximum number of continuous CPU utilization above 1 is 18 samples (180 seconds).
In real life obviously we do not have a physical server with 1 or 2 CPUs to run and Oracle Database instance but the example is to understand that the percentile used depends on how much pain (wait) we are willing to tolerate.
If we had a VMWare cluster where we have Virtual Machines we could certainly accommodate this example database workload. Because we want to leave some headroom for unexpected spikes in CPU utilization we could start assigning 3 vCPUs to this database workload or even 4 to account also for background processes for VM management. The advantage when using VMs is that the resources can be reallocated.
Les try another example.
The data for the next example has been placed in table CPU_STANDARD_EX3
Lets grab some statistics on this database workload.
SELECT MIN(sample_time) START_TIME, MAX(sample_time) END_TIME, ROUND(MAX(sample_time) - MIN(sample_time)) Retention
FROM cpu_standard_ex3;

START_TIM END_TIME    RETENTION
--------- --------- -----------
03-AUG-16 18-AUG-16          15
We had our retention period set to 15 days thus we have data collected for 15 days starting Aug 3th and ending Aug 18th.
SELECT MIN(cpu_data) MINIMUM, MAX(cpu_data) MAXIMUM
FROM cpu_standard_ex3;

    MINIMUM     MAXIMUM
----------- -----------
          0          21
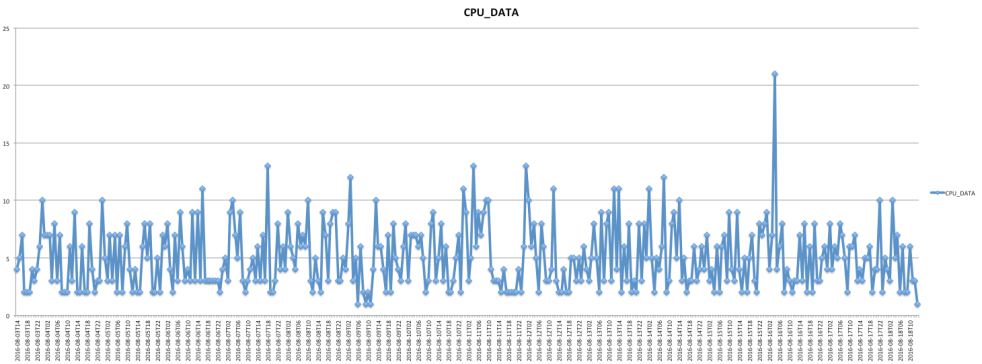
This database has a minimum CPU utilization of 0 and a maximum of 21 active sessions.
SELECT AVG(cpu_data) AVERAGE, MEDIAN(cpu_data) MEDIAN
FROM cpu_standard_ex3;

    AVERAGE      MEDIAN
----------- -----------
.3324691358           0

CREATE TABLE cpu_standard_ex3_hourly
AS SELECT TO_CHAR(TRUNC(sample_time,'HH24'), 'YYYY-MM-DD"T"HH24') THE_HOUR, MAX(cpu_data) CPU_DATA
FROM cpu_standard_ex3
GROUP BY TRUNC(sample_time,'HH24')
ORDER BY 1;
Using the hourly data to create a line chart:
In order to find out the 95th percentile:
SELECT * FROM
(
SELECT TO_CHAR(TRUNC(sample_time,'HH24'),'YYYY-MM-DD"T"HH24') THE_HOUR
      ,ROUND(PERCENTILE_CONT(0.95) WITHIN GROUP (ORDER BY cpu_data)) "95th PERCENTILE"
FROM   cpu_standard_ex3
GROUP BY TO_CHAR(TRUNC(sample_time,'HH24'),'YYYY-MM-DD"T"HH24')
ORDER BY 2 DESC
)
WHERE ROWNUM <= 1;

THE_HOUR      95th PERCENTILE
------------- ---------------
2016-08-14T07               4
Using that query we can build the following table:
100th percentile ->          no wait        -> 21 CPUs
 99th percentile -> longest wait is  36 sec. -> 7 CPUs
 97th percentile -> longest wait is 1.8 min. -> 5 CPUs
 95th percenitle -> longest wait is  3  min. -> 4 CPUs
 90th percentile -> longest wait is  6  min. -> 2 CPUs
 80th percentile -> longest wait is 12  min. -> 2 CPUs
Lets pick the 95th percentile of 4 and get the samples above 4 CPUs.
Obtaining the samples above:
CREATE OR REPLACE PROCEDURE get_samples_above
(
 p_cpu_req          IN  samples_above.cpu_required%TYPE
) IS
BEGIN
   INSERT INTO samples_above
   SELECT p_cpu_req, TRUNC(sample_time, 'HH24'), COUNT(cpu_data) samples_above
   FROM cpu_standard_ex3
   WHERE cpu_data > p_cpu_req
   GROUP BY TRUNC(sample_time, 'HH24');
   DBMS_OUTPUT.PUT_LINE(' ');
   DBMS_OUTPUT.PUT_LINE('get_samples_above: CPU req ' || p_cpu_req);
   COMMIT;
END;
/

TRUNCATE TABLE samples_above;

SET SERVEROUTPUT ON
EXEC get_samples_above(4)

SELECT   cpu_required, TO_CHAR(end_date, 'YYYY-MM-DD"T"HH24') end_date_hour, samples_above
FROM     samples_above
ORDER BY cpu_required, samples_above DESC;

CPU_REQUIRED END_DATE_HOUR SAMPLES_ABOVE
------------ ------------- -------------
           4 2016-08-13T07            12
           4 2016-08-06T07             8
           4 2016-08-09T13             6
           4 2016-08-07T07             5
           4 2016-08-10T07             5
           4 2016-08-08T19             5
           4 2016-08-14T07             5
           4 2016-08-16T07             5
           4 2016-08-05T07             5
           4 2016-08-17T07             5
           4 2016-08-10T05             4
           4 2016-08-11T01             4
...
...
How about 90th percentile?
TRUNCATE TABLE samples_above;

SET SERVEROUTPUT ON
EXEC get_samples_above(2)

SELECT   cpu_required, TO_CHAR(end_date, 'YYYY-MM-DD"T"HH24') end_date_hour, samples_above
FROM     samples_above
ORDER BY cpu_required, samples_above DESC;

CPU_REQUIRED END_DATE_HOUR SAMPLES_ABOVE
------------ ------------- -------------
           2 2016-08-14T07            33
           2 2016-08-06T07            31
           2 2016-08-11T01            27
           2 2016-08-07T07            27
           2 2016-08-08T19            25
           2 2016-08-12T01            25
           2 2016-08-13T07            25
           2 2016-08-05T07            24
           2 2016-08-09T01            23
           2 2016-08-08T07            22
...
...
It seems too busy, lets try 3 CPUs
TRUNCATE TABLE samples_above;

SET SERVEROUTPUT ON
EXEC get_samples_above(3)

SELECT   cpu_required, TO_CHAR(end_date, 'YYYY-MM-DD"T"HH24') end_date_hour, samples_above
FROM     samples_above
ORDER BY cpu_required, samples_above DESC;

CPU_REQUIRED END_DATE_HOUR SAMPLES_ABOVE
------------ ------------- -------------
           3 2016-08-14T07            20
           3 2016-08-05T07            17
           3 2016-08-13T07            16
           3 2016-08-06T07            15
           3 2016-08-07T07            15
           3 2016-08-08T07            14
           3 2016-08-10T07            12
           3 2016-08-04T05            11
           3 2016-08-11T01            10
           3 2016-08-12T05            10
           3 2016-08-17T07            10
...
...
The 3 CPUs correspond to the 93rd percentile.
SELECT * FROM
(
SELECT TO_CHAR(TRUNC(sample_time,'HH24'),'YYYY-MM-DD"T"HH24') THE_HOUR
      ,ROUND(PERCENTILE_CONT(0.93) WITHIN GROUP (ORDER BY cpu_data)) "93th PERCENTILE"
FROM   cpu_standard_ex3
GROUP BY TO_CHAR(TRUNC(sample_time,'HH24'),'YYYY-MM-DD"T"HH24')
ORDER BY 2 DESC
)
WHERE ROWNUM <= 1;

THE_HOUR      93th PERCENTILE
------------- ---------------
2016-08-06T07               3
Lets see what we got here. The busiest hour has 20 samples above 3 CPUs, if all 20 samples are continuous the longest wait would be 200 seconds ~ 3 min. and 20 seconds.
In order to see the “how long” results we run the following:
CREATE OR REPLACE PROCEDURE get_how_long
(
 p_cpu_req          IN  samples_above.cpu_required%TYPE
) IS
  CURSOR c_10s_t IS
    SELECT sample_time, cpu_data
    FROM cpu_standard_ex3
    ORDER BY sample_time;
  v_end_date            cpu_standard_ex3.sample_time%TYPE;  -- to fetch date
  v_store_end_date      cpu_standard_ex3.sample_time%TYPE;  -- to store the final list of dates where utilization went above #CPUs
  v_on_cpu              cpu_standard_ex3.cpu_data%TYPE;     -- to fetch on_cpu
  v_count               NUMBER := 0;  -- to count how many samples the CPU utilization stayed above #CPUs
  v_max_sample          NUMBER := 0;  -- to hold the max sample in each entry of org6_how_long_t
BEGIN
  OPEN c_10s_t;
  LOOP
    FETCH c_10s_t into v_end_date, v_on_cpu;
    EXIT WHEN c_10s_t%NOTFOUND;
    IF v_on_cpu > p_cpu_req THEN
      v_store_end_date := v_end_date;
      v_count      := 1;
      v_max_sample := v_on_cpu;
      LOOP
        FETCH c_10s_t into v_end_date, v_on_cpu;
        EXIT WHEN c_10s_t%NOTFOUND;
        IF v_on_cpu > p_cpu_req THEN
          v_count := v_count + 1;
          IF v_on_cpu > v_max_sample THEN
            v_max_sample := v_on_cpu;
          END IF;
        ELSE
          INSERT INTO how_long VALUES(p_cpu_req, v_store_end_date, v_count*10, (v_count*10)/60, v_max_sample);
          EXIT;
        END IF;
      END LOOP;
    END IF;
  END LOOP;
  CLOSE c_10s_t;
  DBMS_OUTPUT.PUT_LINE(' ');
  DBMS_OUTPUT.PUT_LINE('get_how_long: CPU req ' || p_cpu_req);
  DBMS_OUTPUT.PUT_LINE('get_how_long: Data in mn_how_long_t ');
  COMMIT;
END;
/

TRUNCATE TABLE how_long;
EXEC get_how_long(3);

SELECT cpu_required, to_char(end_date, 'YYYY-MM-DD"T"HH24:MI:SS') "TIME", how_long_sec "SECONDS", round(how_long_min, 2) "MINUTES", max_sample "MAX_SAMPLE"
FROM how_long
ORDER BY cpu_required, seconds DESC, max_sample DESC;

CPU_REQUIRED TIME                    SECONDS     MINUTES  MAX_SAMPLE
------------ ------------------- ----------- ----------- -----------
           3 2016-08-05T07:31:40          50         .83           7
           3 2016-08-07T07:31:40          40         .67           9
           3 2016-08-16T00:41:00          40         .67           7
           3 2016-08-11T05:46:30          40         .67           5
           3 2016-08-13T07:32:10          30          .5           7
           3 2016-08-16T03:31:50          30          .5           7
           3 2016-08-11T07:31:50          30          .5           7
           3 2016-08-10T07:31:50          30          .5           7
           3 2016-08-17T00:41:10          30          .5           6
           3 2016-08-13T07:37:20          30          .5           6
           3 2016-08-16T07:35:50          30          .5           5
           3 2016-08-14T07:44:10          30          .5           5
           3 2016-08-06T01:02:40          30          .5           5
           3 2016-08-04T05:33:10          30          .5           4
...
...
           3 2016-08-18T07:32:20          10         .17           4
           3 2016-08-18T07:35:20          10         .17           4
           3 2016-08-18T07:38:00          10         .17           4
           3 2016-08-18T07:42:50          10         .17           4

574 rows selected.
How about with 4 CPUs.
TRUNCATE TABLE how_long;
EXEC get_how_long(4);

SELECT cpu_required, to_char(end_date, 'YYYY-MM-DD"T"HH24:MI:SS') "TIME", how_long_sec "SECONDS", round(how_long_min, 2) "MINUTES", max_sample "MAX_SAMPLE"
FROM how_long
ORDER BY cpu_required, seconds DESC, max_sample DESC;

CPU_REQUIRED TIME                    SECONDS     MINUTES  MAX_SAMPLE
------------ ------------------- ----------- ----------- -----------
           4 2016-08-13T07:32:10          30          .5           7
           4 2016-08-07T07:31:40          20         .33           9
           4 2016-08-13T07:32:50          20         .33           9
           4 2016-08-06T07:32:40          20         .33           9
           4 2016-08-10T05:46:40          20         .33           7
           4 2016-08-17T00:41:10          20         .33           6
           4 2016-08-08T07:31:40          20         .33           6
           4 2016-08-12T03:44:50          20         .33           6
           4 2016-08-13T07:37:30          20         .33           6
           4 2016-08-16T07:36:00          20         .33           5
           4 2016-08-14T05:46:50          20         .33           5
           4 2016-08-10T07:37:20          20         .33           5
           4 2016-08-13T05:33:00          20         .33           5
...
...
           4 2016-08-11T05:46:50          10         .17           5
           4 2016-08-11T07:31:50          10         .17           5
           4 2016-08-12T00:41:30          10         .17           5
           4 2016-08-12T05:32:10          10         .17           5

306 rows selected.
The 93rd percentile would be a good option, because the longest wait is not more than 50 seconds, however, there are many times when the system goes up above 3 CPUs (574 times), even with 4 CPUs the system goes up above 4 CPUs 306 times.
We could use the 4 CPUs as the number of CPUs for this database. If we wanted this system to have headroom of 50% we would add 4 more CPUs for a total of 8 CPUs. If we wanted to have this as the starting value of a VM for this database workload we could start with 5 (4 + 1 for VM overhead) and monitor to see if more are needed.
As a side note:
I am using this space to recommend the use of Oracle Resource Manager to control the spikes in CPU utilization.
“High database loads destabilize the server. Many operating system vulnerabilities and bugs are exposed at excessive CPU loads. In addition, excessive CPU loads can starve critical applications and monitoring tools running on the server.”
“One key to a healthy database is maintaining a healthy CPU load. Excessive CPU load can destabilize the server and expose operating system bugs. Excessive CPU load can also prevent critical Oracle background processes from running in a timely manner, resulting in failures such as database instance evictions on a RAC database. At such times, your response time may be so poor that you may be unable to debug the source of the excessive CPU load, for example by identifying and fixing a faulty SQL plan. Using Oracle Database Resource Manager, you can ensure that your database’s CPU load is always healthy, thus avoiding all of these problems. Resource Manager manages your CPU load so that all CPUs are fully utilized yet there is no thrashing since no (or very few) Oracle processes are waiting in the operating system run queue. Using a database feature called Instance Caging, you can configure Resource Manager to manage the CPU load to even lower levels.”
Reference: Using Oracle Database Resource Manager
In this blog post we have learned how to choose a percentile to decide how many CPUs are required for our database workload and review how many times the CPU utilization goes above our number of CPUs and for how long that utilization stays above our specified number of CPUs.
With this information we are able to decide how many CPUs we want to allocate for our database.
It is important to size correctly because if we undersusbscribe we risk the system to come to a halt and if we oversubscribe we are spending more money than needed on hardware and licenses.
If you are migrating to a new system and need to know the number of CPUs in the target system which is different from the actual system you need to translate the processing power of the actual server to the new server. If you want to learn how to do that stay tuned for the next blog post: “Sizing post #5: How to map our existing processing power to new hardware.”
